2025 Outlook with entropic methods – Bitcoin Trading Ideas, Analysis
Every year i post an outlook using entropic methods explained in the technical section of this blog. Here you can find the 2015, 2016, 2017, 2018, 2019, 2020, 2021, 2022, 2023 and 2024 forecast update, where you can find more information about this approach.
Updated values for bitcoin (in brackets values of 2024) using daily data since August 2010 (from now on I will use only BITSTAMP data, as today there are not many differences between major Bitcoin exchanges.).
| BTC/USD | |
| Growth Factor G | 1.00099 (1.00099 ) |
| Shannon Probability P (see this as entropy) | 0.5295 (0.5224 ) |
| Root mean square RMS (see this as volatility) | 0.047 (0.047) |
The entropy levels of Bitcoin against the USD showed no significant improvement in 2024. The Growth Factor (G) remained steady at 1.00099% daily compounded, equivalent to about 44% annually. The optimal portion of your total wealth to allocate to Bitcoin increased to 6% (~0.5295*2=1.0448 – 1 = 0.059 or ~6%), driven by a year-long upward trend in Bitcoin’s price, which boosted the Shannon Probability from 0.522 to nearly 0.53, an improvement, but still modest.
“For those who may have forgotten, the Shannon Probability measures the persistence of Bitcoin’s price movement, indicating the likelihood that the asset will experience a positive trend. A value of 0.53 suggests that, out of 100 days, Bitcoin is likely to show an upward movement on 53 days, and either a decline or no significant movement on the remaining 47 days.”
Bitcoin’s historical volatility has remained relatively unchanged this year, aligning with the average recorded since the inception of its historical data in August 2010. Currently, it remains stable at a comparatively high level, particularly when measured against traditional assets such as gold, stocks, bonds, and forex currencies, refer to the chart at the end of this post for more details.
As i said in my last year update it seems that a volatility plateau has been identified, and it is notably substantial higher compared to other assets. This suggests that Bitcoin continues to be a highly speculative asset as its volatility is still too high to be considered a viable reserve asset for central banks, despite increasing recent discussions around its potential in this role.
| 2025 Price forecast | Full Historical Volatility | Half Historical Volatility |
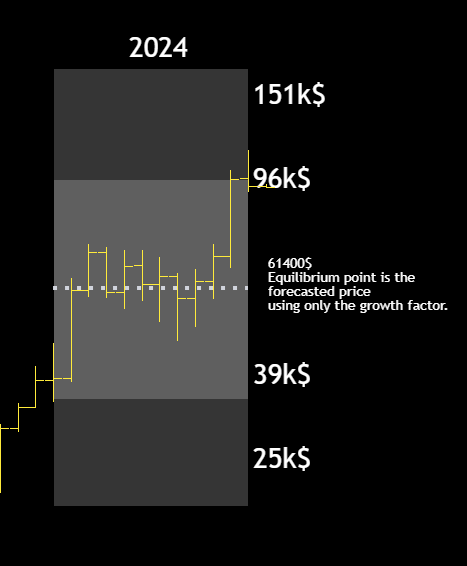
| Forecast using only G* or Growth Factor | ~132,300$ | ~132,300$ |
| Upper bound adding volatility | ~328,000$ | ~209,300$ |
| Lower bound subtracting volatility | ~52,300$ | ~85,100$ |
*132,300$ is obtained with 1st January as a starting price (around 91900$) times (1.00099^365)=~1.44 | 91900*1.44=~132300$, just change 365 with the number of days you prefer for a different forecast.
What happened in 2024?
For this year, I may consider taking profits on my position if the market shows signs of weakness below the critical $85,000 level. As a reminder, I initiated my bullish position in February 2023 at approximately $22,500.
I also recommend cautious long-term trading strategies this year. The growing speculation around Bitcoin as a potential reserve asset for central banks could lead to a spectacular market top. In that scenario, preliminary support levels for 2026, calculated using a starting price of $91,900 on January 1, 2024, and a two-year window, suggest potential declines between $54,000 and $100,000. If Bitcoin reaches a significant top, potentially at or above $200,000, these levels become plausible targets for a subsequent correction in 2026. These values are provided as a preview to illustrate possible directions, but only if such a dramatic peak occurs this year.
That said, I remain firmly confident in the $85,000 support level as a key indicator of the current uptrend’s strength. Regardless of the various scenarios discussed, keep this level in mind as your primary reference point.
As for the upper boundary, I believe it is highly improbable to reach or surpass $328,000 during 2025.
Feel free to reach out with any questions, and I’ll see you in the next update. Happy New Year!


Post Comment