The Only Guide You’ll Ever Need
If you’ve ever searched for the “best MACD settings,” you’re not alone. It’s one of the most frequently asked questions among traders, both new and experienced.
The MACD (Moving Average Convergence Divergence) indicator is one of the simplest yet most powerful tools in technical analysis. But its effectiveness depends greatly on how it’s set up and the type of market you’re trading.
The beauty of MACD lies in its ability to show both trend direction and momentum at the same time.
When properly configured, it can reveal potential entry and exit points long before the average trader reacts. But the challenge lies in this: one setting rarely fits all.
The ideal MACD settings can vary depending on the timeframe you’re trading and the volatility of the asset itself.
Let’s take a deeper look at how MACD works, what its settings mean, and how you can optimize them for different market conditions.
Post Summary
Want to Master Crypto & Forex Trading?
Jude Umeano, one of Nigeria’s most respected and successful traders just launched Afibie, a mentorship platform built to help you earn your first $10,000 and beyond from the markets.
Whether you’re new or stuck at break-even, this is your next step.👉 Visit Afibie now.
Understanding How MACD Works

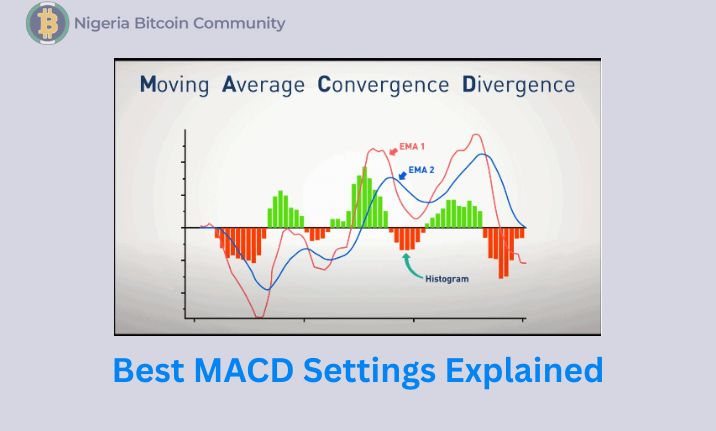
The MACD consists of three key components:
- A fast moving average (EMA)
- A slow moving average (EMA)
- A signal line, which smooths the difference between the two EMAs
The formula is simple:
MACD = (12-period EMA) – (26-period EMA).
And the signal line is a 9-period EMA of that MACD line.
The histogram, the bars you see above or below the zero line, represents the difference between the MACD line and the signal line.
When the histogram rises above zero, momentum is increasing; when it falls below, momentum is weakening.
To understand how this works in real trading, imagine Bitcoin on a 1-hour chart.
When the 12 EMA crosses above the 26 EMA, it means short-term price momentum is accelerating faster than the longer-term average.
This is often interpreted as a buy signal. Conversely, when the 12 EMA crosses below the 26 EMA, it indicates weakening momentum, a possible sell signal.
However, while this default 12-26-9 setting works as a foundation, it doesn’t always perform optimally across all timeframes or markets.
The Default MACD Settings (12, 26, 9): Why They Exist

The 12, 26, and 9 values were originally designed for the U.S. stock market in the 1970s, when daily data was the norm and traders looked for medium-term trends.
The 12-day EMA represented roughly two trading weeks, and the 26-day EMA covered about a month.
In today’s 24/7 markets, especially in crypto, those time assumptions no longer hold.
Traders now deal with shorter timeframes, higher volatility, and faster-moving prices.
Using the default settings in a 1-minute or 5-minute chart can make the MACD too slow, causing it to miss early signals or give lagging entries.
So while the default is a good starting point, optimizing the settings for your trading style can yield sharper signals and fewer false alerts.
Best MACD Settings for Different Timeframes

The best MACD settings depend on how long you hold trades and the kind of volatility you face.
Shorter timeframes require faster settings to capture quick momentum shifts, while longer ones need slower settings to filter out noise.
– For Short-Term Traders (1-Minute to 15-Minute Charts)
If you’re day trading or scalping, you need your MACD to react quickly. Using faster settings like 6, 13, 5 or 8, 17, 9 can help capture smaller, sharper moves.
For example, let’s say you’re trading ETH on a 5-minute chart. You might notice that the 12-26-9 setting lags, by the time the MACD line crosses the signal line, price has already moved significantly.
Switching to 6-13-5 makes the indicator more responsive, showing earlier crossovers and giving you a chance to enter before the big push.
The trade-off is sensitivity: faster settings also generate more false signals.
To handle that, many traders combine MACD with volume confirmation or support/resistance zones to avoid entering during sideways markets.
– For Swing Traders (1-Hour to 4-Hour Charts)
Swing traders prefer smoother signals that capture multi-day moves. Here, the classic 12, 26, 9 still works quite well. It filters noise while keeping you aligned with broader momentum.
Let’s say you’re tracking Solana on a 4-hour chart. Price makes a slow, steady climb, and the MACD histogram builds gradually above the zero line.
You might enter when the MACD line crosses above the signal line, then stay in the trade as long as the histogram remains positive.
This setup helps you catch sustained trends without reacting to every small pullback.
Some traders tweak it slightly to 10, 30, 9 to slow things down further, especially in volatile pairs, so they’re not shaken out by minor fluctuations.
– For Long-Term Traders (Daily to Weekly Charts)
Position traders or investors use the MACD to confirm big-picture trends. On higher timeframes, noise is less of a problem, so you can stick to slower settings like 19, 39, 9 or even 24, 52, 9.
Take, for instance, a weekly chart of Apple stock. A 24-52-9 MACD setup will rarely generate signals, but when it does, those crossovers usually mark long-term shifts in trend, sometimes lasting for months.
These settings work because they smooth out short-term volatility and highlight genuine momentum changes.
However, they’re unsuitable for short-term traders who rely on quicker entries and exits.
Adjusting MACD Settings for Different Assets
Another key factor is the type of asset you’re trading. Forex pairs and stocks often move more steadily compared to cryptocurrencies, which can be extremely volatile.
In crypto, faster settings like 8, 17, 9 are often preferred to keep pace with sudden price bursts. In contrast, for slow-moving forex pairs like EUR/USD, the classic 12, 26, 9 or even 15, 35, 9 may be more appropriate.
The idea is to balance responsiveness and reliability. Too fast, and the MACD whipsaws; too slow, and it misses profitable opportunities.
Combining MACD With Other Indicators
The MACD is powerful on its own, but it’s even more reliable when used with other tools for confirmation.
For instance, combining MACD with the Relative Strength Index (RSI) helps filter false signals.
If the MACD gives a bullish crossover while the RSI is below 50 and rising, that’s a stronger buy confirmation. But if RSI is overbought (above 70) at the same time, it may be better to wait.
Similarly, pairing MACD with support and resistance or trendlines provides context.
Suppose you see a bullish MACD crossover right above a strong support level, that’s a high-probability setup. But if it occurs in the middle of a choppy range, it’s better to skip.
Common Mistakes When Using MACD
A common mistake traders make is using MACD as a standalone trigger.
It’s important to remember that the MACD is a lagging indicator, it reacts to past price data, not future ones.
Entering every time a crossover happens can result in multiple small losses, especially in sideways markets.
Another mistake is ignoring the market regime. MACD performs best in trending markets but gives unreliable signals in ranging ones.
If you find that the histogram keeps flipping between green and red with no clear direction, it’s a sign that the market lacks trend strength, step aside until momentum builds.
Lastly, traders often forget to test their settings. What works on BTC/USDT 1-hour may fail on DOGE/USDT 5-minute.
Always backtest your settings over several market conditions before using them live.
Is There a Universal Best MACD Setting?
The short answer is no. The “best” MACD setting depends on your trading style, timeframe, and asset.
The 12-26-9 remains the most balanced configuration for general use, but experimentation is key.
If you’re scalping or day trading, try 6-13-5 or 8-17-9. For longer trades, go with 19-39-9 or 24-52-9.
The goal isn’t to find a perfect formula, it’s to find one that fits your rhythm and helps you interpret momentum clearly.
Conclusion
The MACD is a timeless indicator, not because it’s perfect, but because it’s adaptable.
Understanding how to tune its settings gives you the ability to read market momentum on your own terms.
Whether you’re catching fast intraday moves or holding positions for weeks, the MACD can help you see when momentum is building and when it’s fading.
But like all tools, it’s only as good as the trader using it. Take time to experiment, backtest, and learn how different settings behave under different conditions.
Over time, you’ll develop an intuitive sense of when the MACD’s voice matters, and when it’s not worth reacting to.
Did you find the post helpful? Drop your thoughts in the comments, and if you found this guide helpful, don’t forget to share it with a fellow trader who could use it.


Post Comment