Path of least resistance appears to the downside
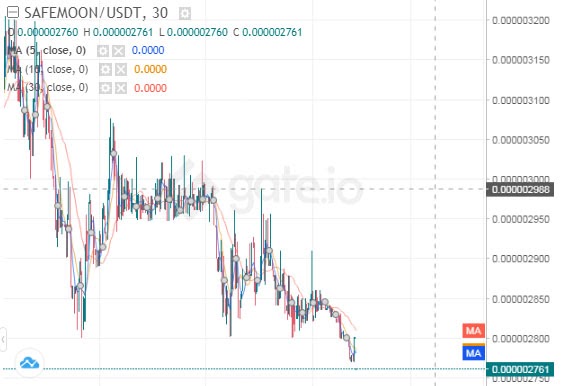
SafeMoon is attempting a price recovery from two-week lows of $0.000002769 on Saturday, as the bears catch a breather after two straight days of declines.
There is no encouraging news for SAFEMOON Coin, as chart-driven price movements continue to lead the way amid a lackluster performance seen across the cryptocurrency market.
The meme-based coin is currently consolidating the recent downside around the price of $0.0000028, shedding 4% on the week.

SAFEMOON’s technical setup on the daily price chart paints a bearish picture, despite the latest uptick.
The price confirmed a downside breakout from a symmetrical triangle pattern on Friday, paving the way for deeper losses.
Therefore, SafeMoon price bears remain poised to test the key support near $0.000002765, below which the price of $0.0000020 psychological level could be put at risk.
The Relative Strength Index trades flattish while within the bearish territory, keeping the bearish price undertone intact for SAFEMOON.
Alternatively, if the buyers find acceptance above the triangle support-turned-resistance level at $0.000002912, then the rebound could gain momentum towards the bearish 21-Daily Moving Average at $0.000003022.
Further up, the triangle resistance level at $0.000003131 could come into play, which is taken out on a daily closing basis would invalidate the bearish pattern breakdown. Such a move may then call for a bullish reversal in the near term.
XLM/USD: Downside potential remains intact amid bearish technical setup


Post Comment